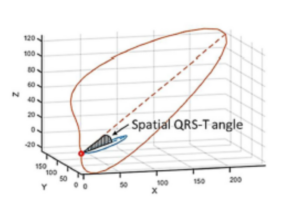
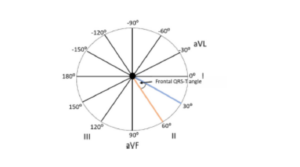
In a very recent article in Nature Communication a team lead by William Young and Larisa Tereshchenko present further insights regarding using spatial QRS-T angles to indicate CVD risk. The 3-dimensional spatial and 2-dimensional frontal QRS-T angles are measures derived from the vectorcardiogram. It has been established that these Vectorcardiogram derived parameters are independent risk predictors for cardiovascular disseasses and/or arrhythmias but the underlying biology is yet unknown.
The authors have executed the largest study so far to investigate the biological relationship with these ECG parameters and the generic profile of patients.
And their results are impressive. They have identified a large group of genetic DNA indicators which can be related to the measured ECG data. And within this large of 61 spatial QRS-T angles parameters 7 have never been reported for other electrocardiographic measures.
In their study the team has found relationships with a wide range of cardiac disorders such as muscle contractions, hypertrophy, atrial fibrillation (AFIB), atrioventricular blocks, arterial embolism. And when these ECG features are also genetically determined associations with fascicular and bundle branche blocks or possible.
Based on the results of this study the use of simple ECG parameters such as the spatial QRS-T angle become important as a fast and effective way to predict patient risk. And not without reason. Recent studies have reported associations of the spatial and frontal QRS-T angle with risk for arrhythmogenesis, sudden cardiac death and cardiac-related mortality. In another population-based study, an abnormal spatial QRST angle was associated with a five-fold increased risk of cardiac and sudden death. No other conventional cardiovascular or ECG measure provided higher hazard ratios.
Going back to the roots of Vectorcardiography
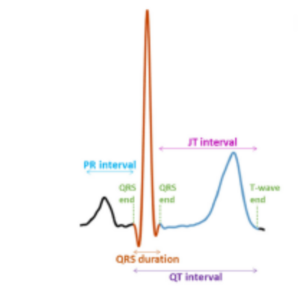
As stated in the article of Young and Tereshchenko: “Abnormalities of ventricular depolarization and repolarization are a cause of malignant arrhythmia, which are associated with cardia morbidity and mortality. Mechanisms underlying the relationship of conventional electrocardiographic (ECG) measures with the QT interval and QRS duration have previously been explored and highlight the role of cardiac ion channels. Spatial and frontal QRS-T angles are the angles between the directions of ventricular depolarization and repolarization in 3- and 2-dimensional space.
In the daily clinical routine vectorcardiographic measures are not currently. And delivering a vectorcardiographic output from the ECG recording is not standard practice or an available option in well-known ECG recorders from some of the major brands. There has been a resurgence of interest in their potential clinical utility, which has coincided with computational advances for efficient calculation of these markers. Using Spatial QRS-T angles to indicate CVD risk is going back to the roots of Vectorcardiography
And going beyond…
With CineECG we are offering the next level of Vectorcardiography based ECG analytics. Determining the spatial QRS-T angles is a routine part of the software and an in between step in relating the ECG data to the heart anatomy and visualize not only the direction of the heart activation but also the location of the heart activation during the activation and recovery cycle.
The added value of the Cleveland Clinic Study is another addition of parameters to be used in our standard analysis and we look forward to achieve further progress in the quality and accuracy of both screening and prediction of cardiovascular disease. In this context using spatial QRS-T angles to indicate CVD risk is valued as another step forward.